Viewing posts for the category Infographics
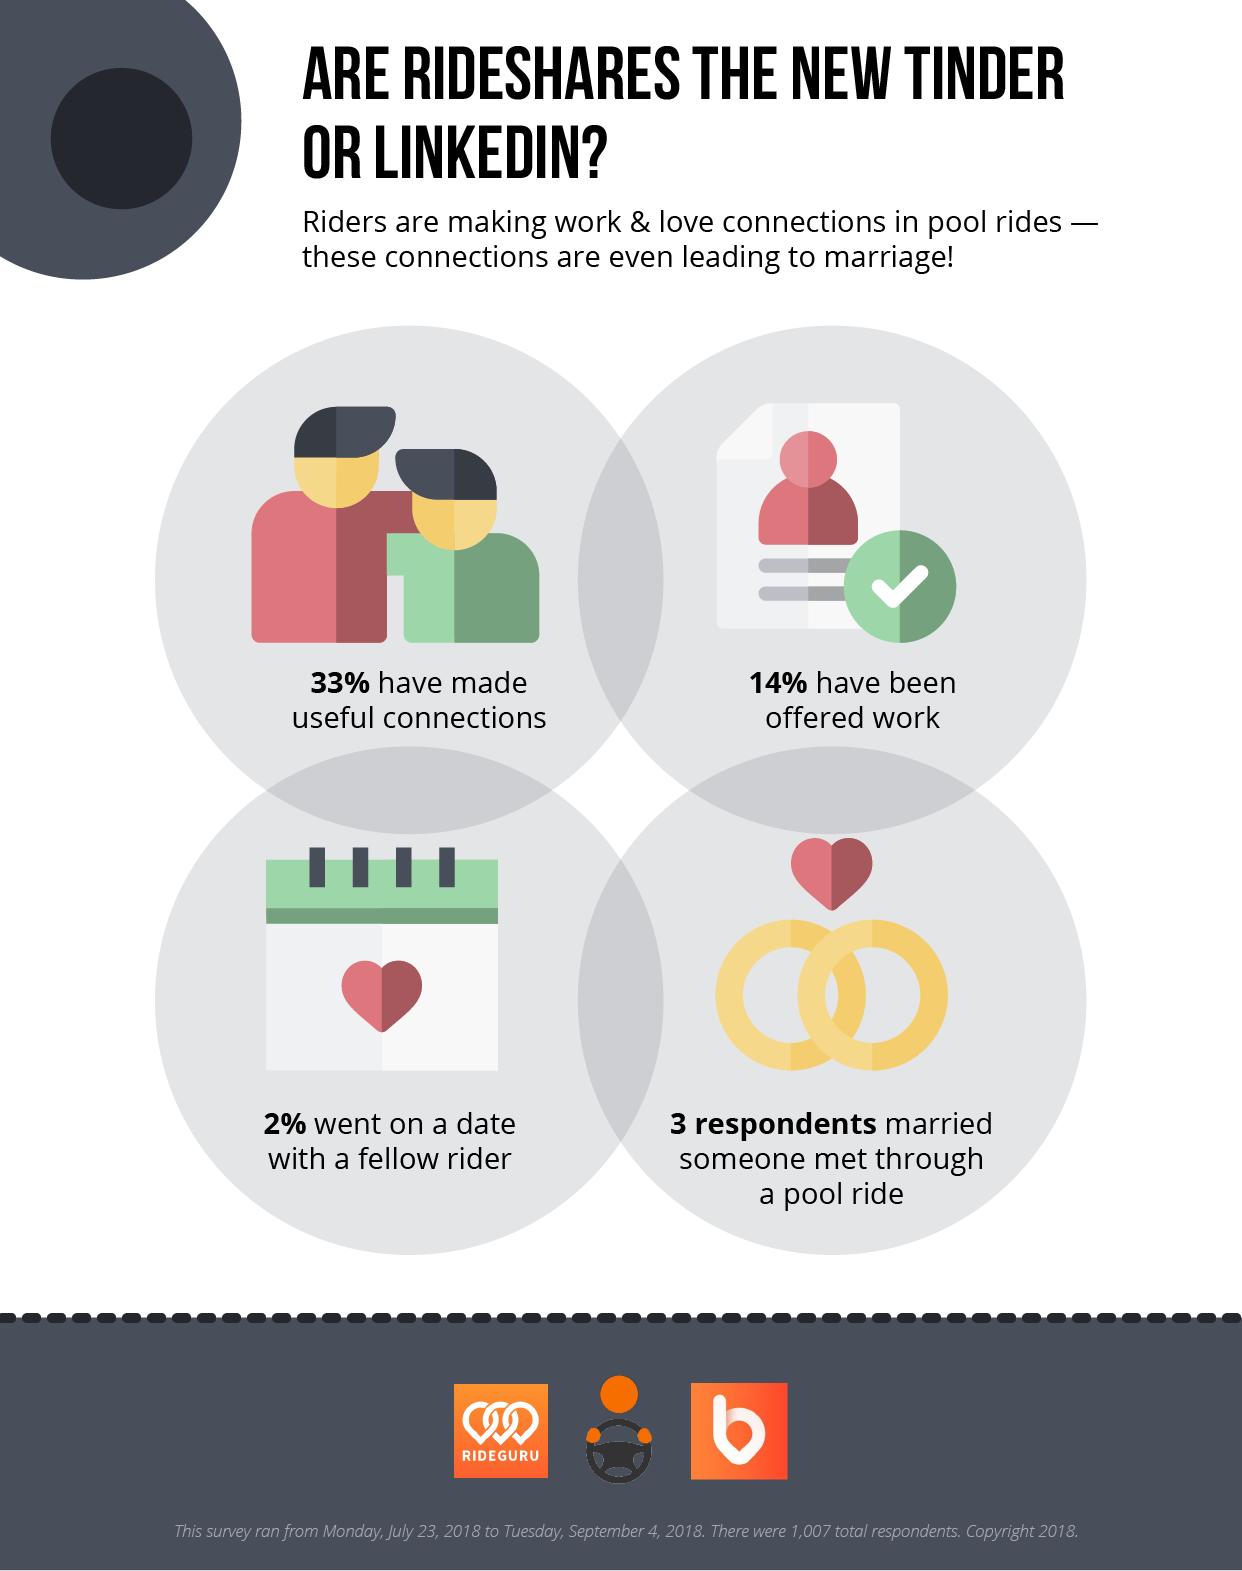
According to our recent survey, riders are really connecting with their fellow pool riders. While the numbers are still slightly low for finding love in an Uber, 33% did make a useful connection of some sort and 14% have been offered work! Maybe one day Uber will announce "UberJOB", the Uber service for those looking to network.
Have you found love in a rideshare? Let us know on our forum!
Check back weekly for more insight into our top survey takeaways!
What is the impact of rideshares on our society?
Rideshares are changing lives. And they are changing lives for the better. In a recent study, we polled over 1,000 rideshare users to gain further insight into how our society uses and views on-demand transportation. One main takeaway we found was that riders in general view ridesharing very fondly. In fact, 23% of respondents claim that ridesharing allows them to lead better lives.
When we break this statement down further we find that the top reasons ridesharing is making our society happier is that people feel they are more social …
read moreAccording to our recent survey, yes, rideshares really do have an impact on drinking and driving. 68% of respondents claimed that rideshares such as Uber and Lyft have prevented them from driving under the influence. That is a huge number of people who otherwises would have driven drunk! In fact, ridesharing has become so popular (and easy!) that 39% of our survey respondents said that they were less likely to purchase a vehicle now.
Do you agree with these statistics? Let us know on our forum!

Check back weekly for more insight into our top survey takeaways!
How often do people take rideshares?
Income level and ridesharing, how our incomes affect our rideshare use.
This fall we completed the largest rider rideshare survey ever compiled. Through our fans responses we have gained further insight into how our society uses and views on-demand transportation.
One major takeaway we found, was that as a community, we LOVE rideshares. According to our survey respondents 35% of people take rideshares at least once per week. On top of that 68% of people see themselves riding even more in the future.
Not only are people taking rideshares on a regular basis but …
read moreThanks to the many RideGuru fans who completed a joint rideshare survey conducted by RideGuru, Bellhop, and The Rideshare Guy, we now have more insight into how our communities use and view rideshare services.
With over 1,000 total respondents, this comprehensive survey was the largest of its kind focused on passenger rideshare use. Respondents spent over 150 hours answering 41 in-depth questions across rideshare habits, spend, impact, future technologies as well as other shared mobility options such as bikes and scooters.
The survey results have been …
read more